This post has been migrated from www.experimentsincode.com, we apologise if some of the images or content is missing
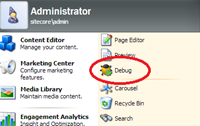
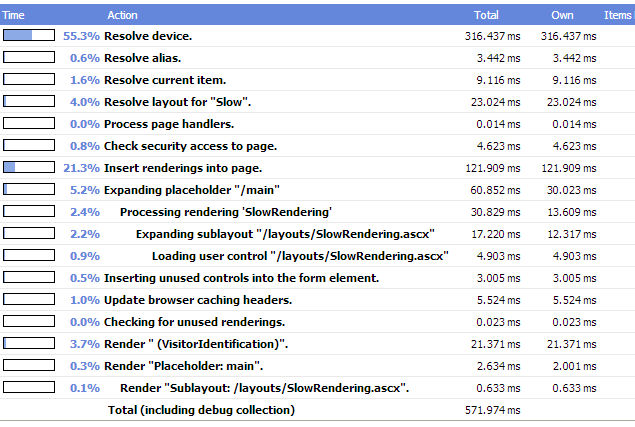
Most Sitecore developers know about the Sitecore debugger, if you don't you can access it from the Sitecore menu: This will then load your site in debug mode, if you scroll down the page you should find a breakdown of the rendering process the page went through with some useful information such as duration and items accessed. This in itself is very useful for diagnosing which renderings are taking a long time, for example in the screenshot below I can see that a single rendering is taking around 2 seconds to render by looking at the Profile section: However this isn't the limit of the debug tool, it is possible to get your own profiling information outputted to this page as well. This is done using the following static methods: Sitecore.Diagnostics.Profiler.StartOperation("some value");
Sitecore.Diagnostics.Profiler.EndOperation("some value");
The string value passed into to the methods is the value that gets displayed in the Profile output. This value needs to be unique within their scope, lets update my slow rendering so that I can see some custom profiling information coming out:
Sitecore.Diagnostics.Profiler.StartOperation("Why so slow");

Thread.Sleep(2000);

Sitecore.Diagnostics.Profiler.EndOperation("Why so slow");
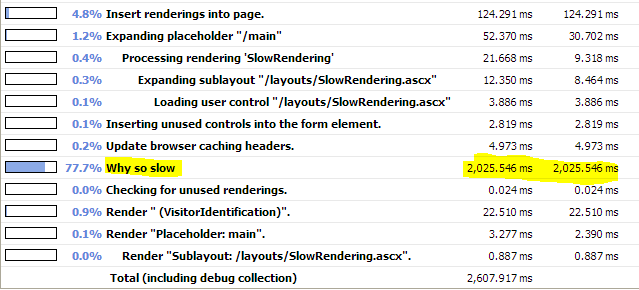
And the result in the debug tool:
With this you can start to sprinkle your code with profiling code and start to see some useful stats.
Watch out
Depending on where you put your slow code depends on where you will see the slow response reported. For example I have moved my slow code to the OnLoad method instead of the Render method: protected override void OnLoad(EventArgs e)
{
Thread.Sleep(2000);
base.OnLoad(e);
}
This no longer shows in the profile section:
Instead this now appears in the Sitecore Trace section of the debugger in the entry that follows the "Adding Http Header to Indicate last modification" entry.
The reason for this is that the Profile section only shows (I think) information when the rendering events are being called and the OnLoad is outside this scope.
There is a way to get around this and that is to use custom profile entries, so lets update the OnLoad event like so:
        protected override void OnLoad(EventArgs e)
        {
            Sitecore.Diagnostics.Profiler.StartOperation("Why so slow");

            Thread.Sleep(2000);

            Sitecore.Diagnostics.Profiler.EndOperation("Why so slow");
            base.OnLoad(e);
        }
This now produces data in the Profile section:
Syntactic Sugar
I personally don't like having to write the two separated lines because they are disconnected from each other. I would much rather use a using statement. We can do this by creating a class that implements IDisposable and manages the profiler calls: public class Profile : IDisposable
{
private readonly string _name;
public Profile(string name)
{
_name = name;
Sitecore.Diagnostics.Profiler.StartOperation(_name);
}
public void Dispose()
{
Sitecore.Diagnostics.Profiler.EndOperation(_name);
}
}
I can now update my slow rendering with a slightly cleaner version of the code:
using(new Profile("Why so slow"){

  Thread.Sleep(2000);

}


